Adani Power has turned into a muli-bagger in recent times.
Stock hit all time high of INR 312 on 28th April 2022, 820.65% Jump from November 2020 level (INR 37)
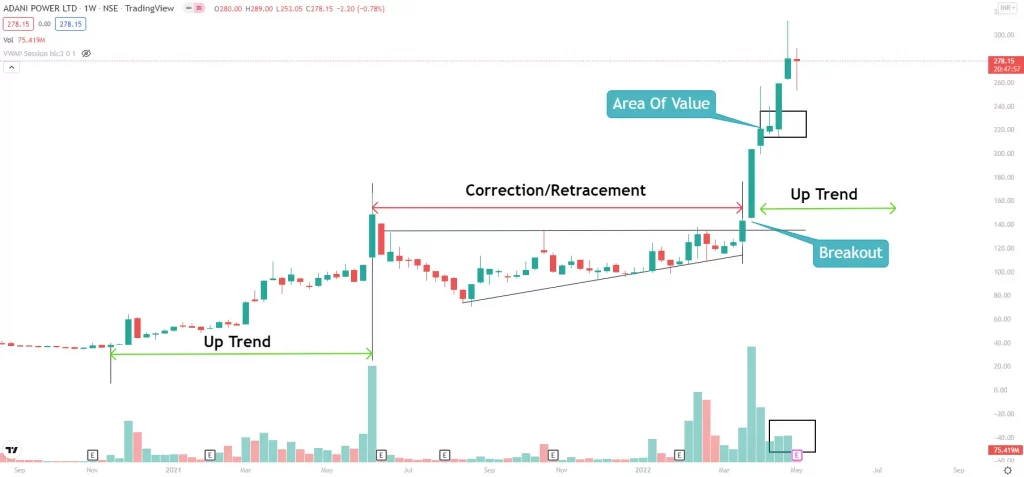
Technical Analysis of Adani Power Ltd
- On the technical chart, the stock is trading in an overbought zone.
- A trend always has its correction. In the weekly chart, the stock jumped to 312 from 117 in the current weekly trend but, the retracement of this move is due and the market may correct at any time.
- Meanwhile, the new area of value is formed near the 200 level, any dip up to 200 should be taken as buying opportunity.
- Currently, the stock is not at a very favorable location due to high risk and low reward
Fundamental Analysis of Adani Power Ltd
Today, i.e., on Thursday, May 05, 2022, it posted very good Q4 results for the annual year 2021-2022.
Results can be decoded as follow:
- Consolidated net profit jumped to Rs 4,645.47 crore in the March quarter from Rs 13.13 crore in the same quarter of last fiscal. The profit jump is mainly due to the higher revenues.
- The consolidated net profit for FY 2021-22 reached Rs 4,911.58 crore from Rs 1,269.98 crore in FY 2020-21.
- Also, in the last fiscal, the company’s total income increased to Rs 31,686.47 crore from Rs 28,149.68 crore in the same period a year ago.
- The total income of the company rose to Rs 13,307.92 crore in the quarter that ended on March 31, 2022, from Rs 6,902.01 crore in the same period a year ago.
Conclusions
- The fundamentals of the stock are improving every quarter, so it can be considered for investment.
- The power sector is booming in India, and Adani power has the ability to lead the industry.
- Use technical levels for pinpoint entry into the stock.
- 200-220 is a very good range to accumulate it again.
Subscribe to our trading page on Instagram and Telegram for daily insights about trading moves.