
Introduction
Let’s analyze the Bharti Airtel stock chart on a multi time frame analysis. Multi time frame analysis is an important aspect of price action trading and it can dramatically improve the accuracy of your trades. So here we are starting with a weekly time frame.
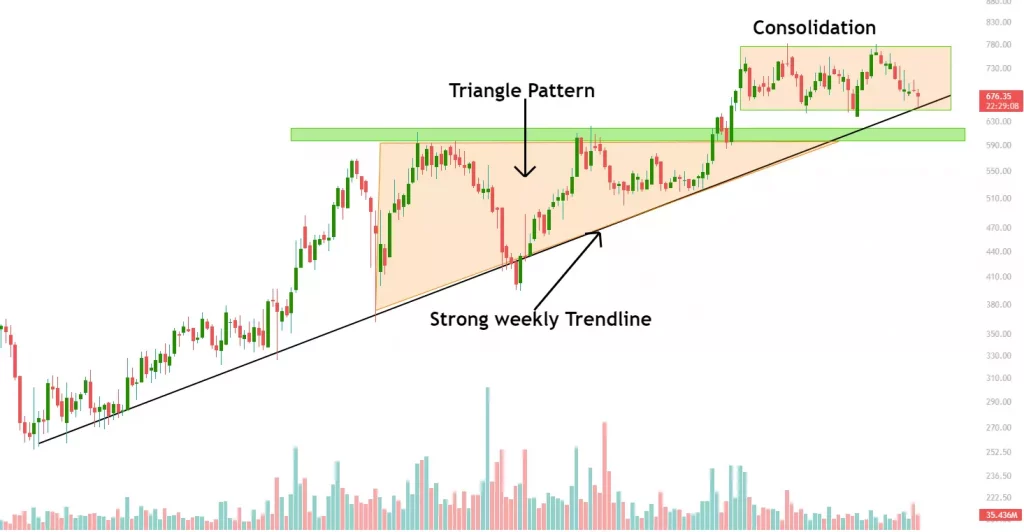
Weekly Chart
- In weekly time frame, Bharti Airtel is on the uptrend
- Stock is currently running into a horizontal channel and strongly holding the price
- Lower level (650-675) of this channel is demand zone and upper level (750-775) is supply zone
- The demand zone is also the previous breakout level which increases the probability of the setup
- In range bound market, one should attempt a buy low and sell high strategy
- In such market conditions, breakout and breakdown in smaller time frame usually fail.
- A range bound movement in higher timeframe (e.g., monthly, weekly) can be trending move in smaller time frames like daily and 4 hour time frame
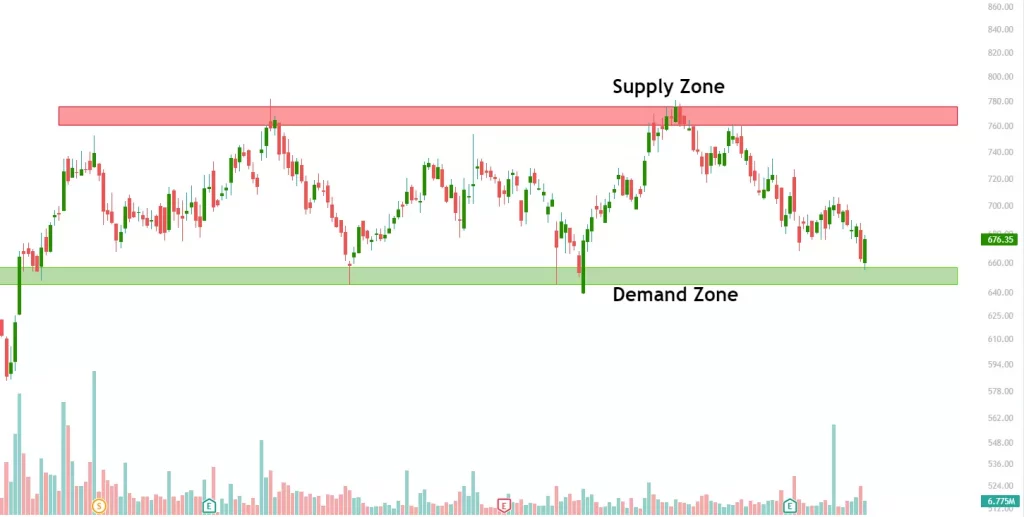
Daily Chart
- In Daily chart, the consolidation of weekly chart gives good trading opportunity
- In the daily chart, the stock is currently at its demand zone and it may be considered a good accumulation area
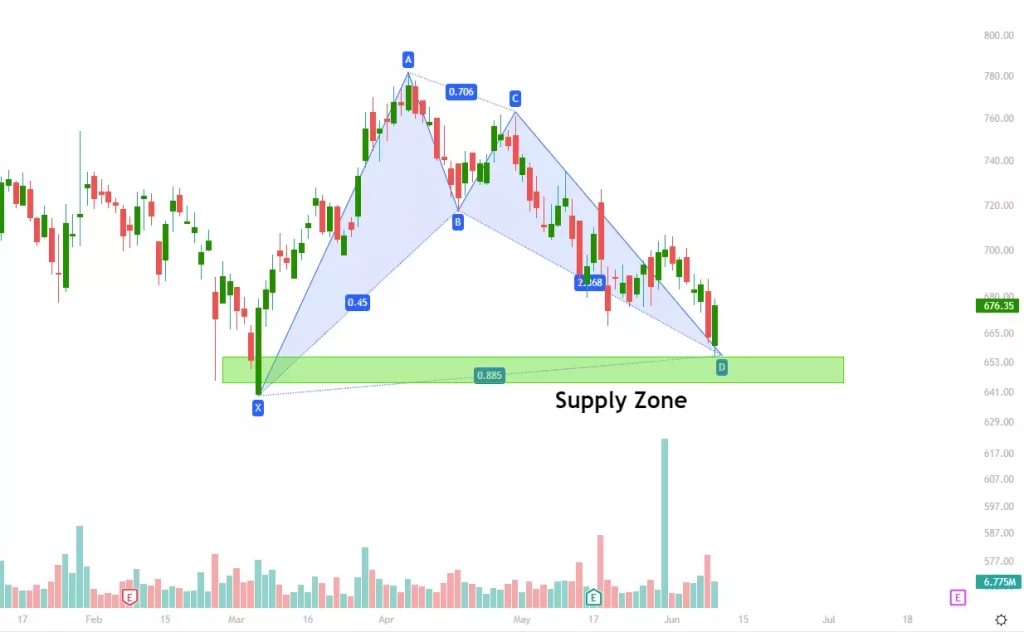
- The stock is also forming a bullish harmonic pattern “XABCD”
- Upside major resistance at the upper range of the channel (750-760)
- It is currently at a good risk reward area for buying but safe traders need to wait for a bullish price action
- In weekly trend line and previous breakout level, a demand zone and harmonic pattern are making confluence in the daily chart.
- In price action trading confluence increases the probability of success
Conclusion
Bharti Airtel is currently at a very good buying level and a swing trade can be initiated here for educational purpose. Swing trade entry price range is 650-670 with stop loss level of 625.
P.S.: The trade explained here is solely for educational use.
Subscribe to our trading page on Instagram and Telegram for daily insights about trading moves.