Understanding a trend is the most important aspect of trading, you may recall the most famous saying “trend is your friend”
So, as the name suggest, trend lines are one of the most versatile tools in trading.
Irrespective of the time frame, you can use this tool in any trading type like intraday trading, short term trading, swing trading, or even in positional trading.
But many traders failed to understand the correct use of the trend lines.
The funny part is, a beginner’s chart with multiple trend line looks like this.
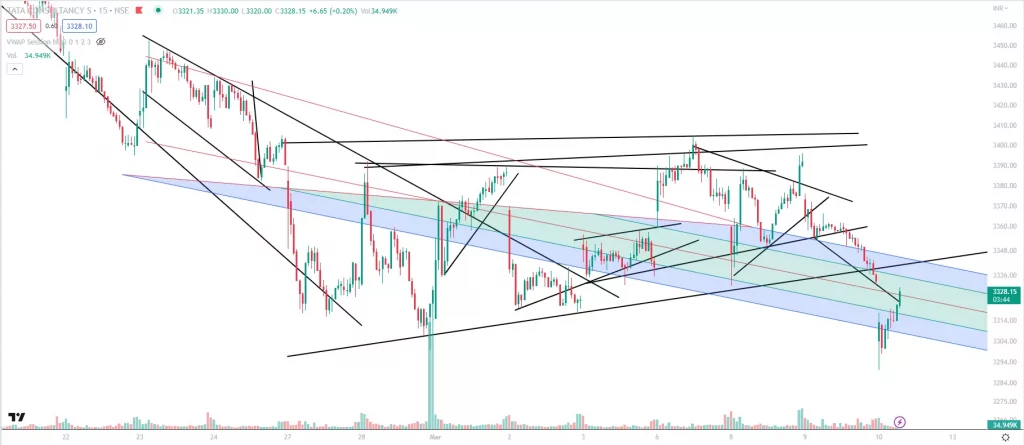
Funny! isn’t it?
It is not that the trend lines are wrong, but they are failed to fulfill their intended purpose. These type of lines and drawings are not concluding anything out of it So these drawings are of no use.
Well !! so how to use it correctly to make profits from the market?
Here I am going to explain in details about the trend line along with a powerful trend line strategy that actually works.
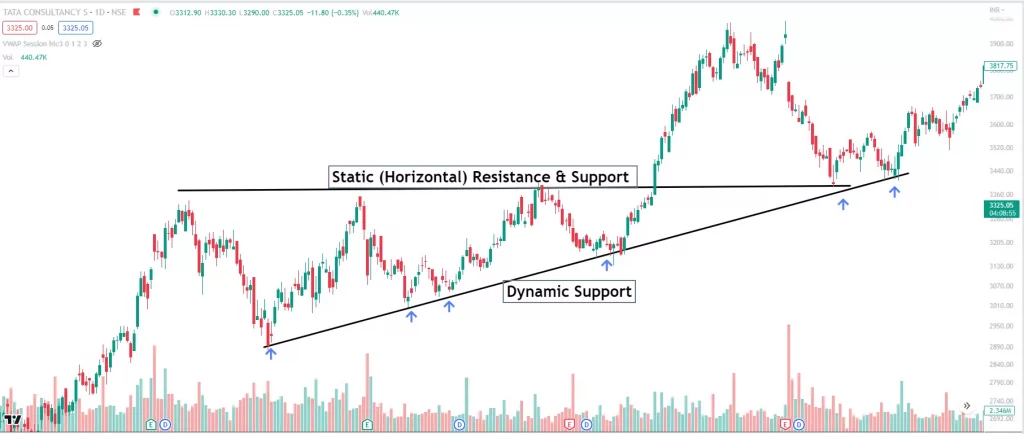
I am pretty much sure that you are aware about horizontal support and resistance level. Horizontal support/resistance levels are area of value zone.
Trend lines are no different and suggest the potential area of value. Basically, trend lines are the dynamic support/ resistance levels on the chart.
Here is the example of a horizontal (static) and trend line (dynamic) support line.
In basic terms we may define it like:
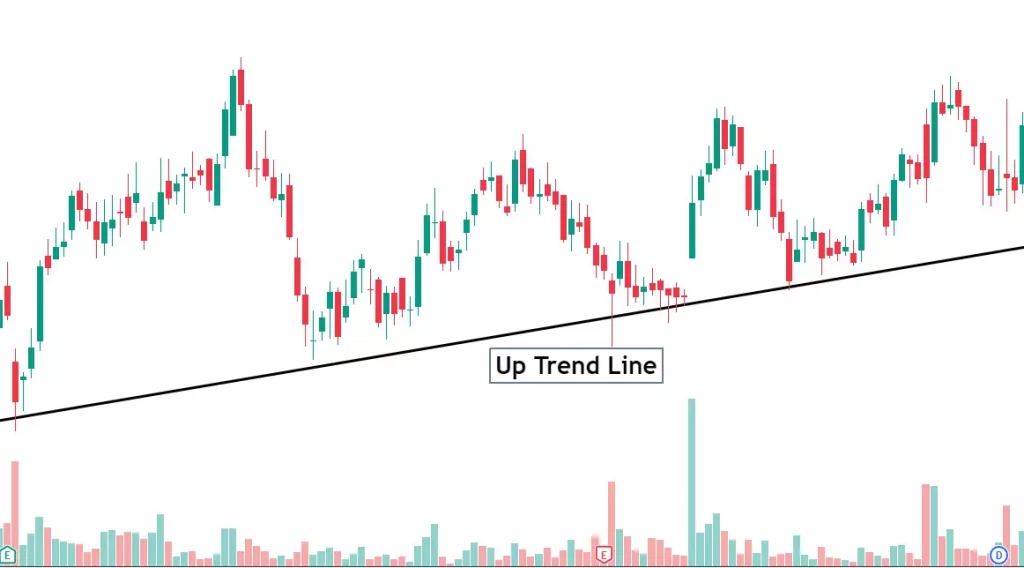
- Upward trend line indicates an uptrend or buying pressure
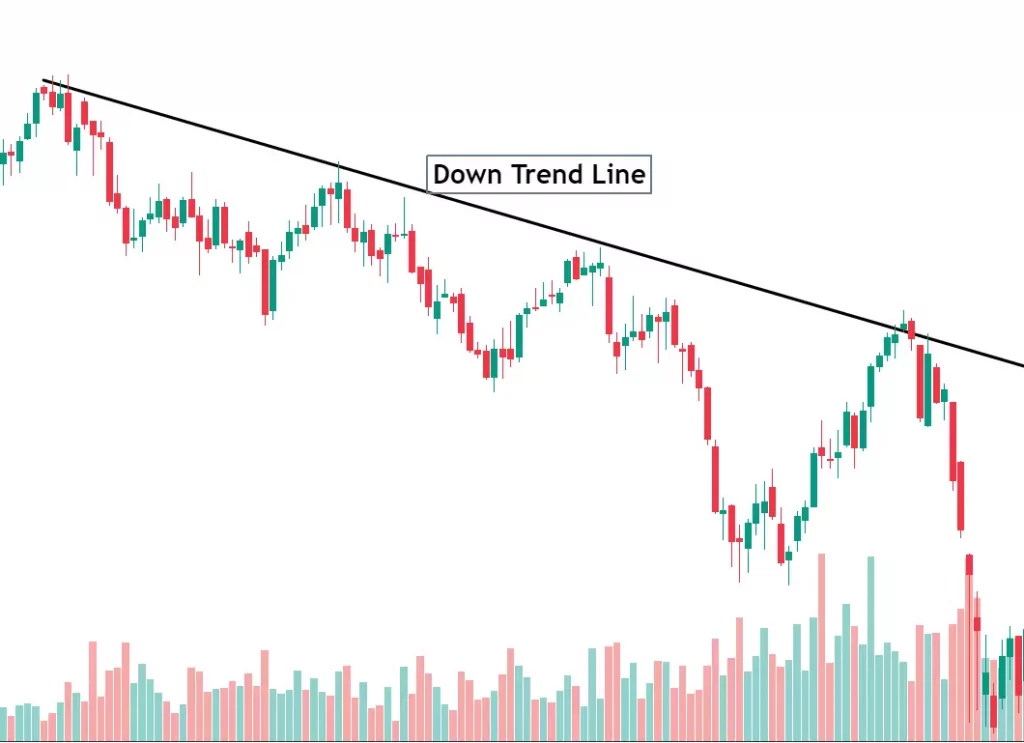
Downward trend line indicates a selling pressure or down trend
Before directly jumping on understanding the strategies based on trend lines we need to understand the correct way of drawing trend lines.
How to Draw a Trend Line correctly
Remember, every line that you draw on the charts are not valid trend line and odd of finding a high probability trade based on random trend lines are very thin.
First, we need to understand which trend lines are important and which trend line we shall avoid.
You may not be knowing this till now, here I am going to reveal the correct way that works.
Keep Reading Carefully….
Here’s how to draw a Trend Line correctly…
To draw a trend line you must:
- Focus only on the major swing points and ignore everything else
- Connect at least 2 major swing points (more is better)
- Adjust it so that you get the greatest number of touches (whether it’s body or wick)
Pro-tip:
- Use wick in case of higher time frame like daily weekly monthly
- Use body of the candle in case of intraday chart
Here’s a Trend Line example:
Being a dynamic support/resistance level on the chart, trend line need to be adjusted with time. For example, if price breaks a Trend Line and then recovers and you need to “adjust” the Trend Line to fit the recent price action.
So, till now you have understood how to draw trend lines correctly.
Now we can move on to the using trend line to make profit from the market.
How to use Trend Line to identify the direction of the trend and understand when the market condition has changed
Identifying the trend using trend line is super easy.
Once you drawn the trend line correctly the next is to observe where it is pointing.
- “Is the Trend Line pointing higher or lower?”
- If it’s higher, then the market is in an uptrend (and vice versa).
But wait, is this all about the trend line is?
Certainly, No!!
As a price action trader there is a lot more that we can understand from the trend line. A trend line not only indicates the trend but, it also gives a clue about the strength in the market, and changing market conditions.
The most important aspect apart from its direction is the steepness of the trend line. A flat trend line indicates that price is going nowhere and just moving in a range.
An example is below:
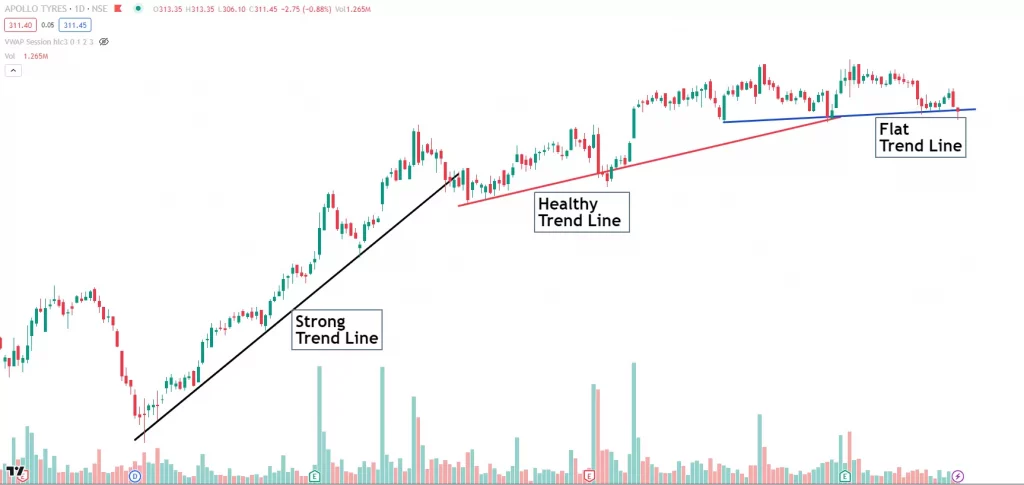
But wherever you see a trend line with higher steepness then it indicates that market is very strong. But remember, a strong market conditions can climax any time, so the higher steepness also indicates a possible market climax.
You probably wondering why the hell Is this important?
But this piece of information is very important for a price action trader. Because, market conditions are changing rapidly and if you know market conditions are changing, you can adjust your trading strategy accordingly.
Trend line Trading Strategies
1. The Trend Line Breakout Strategy
A real trader knows that trading a trending move is equally difficult when compared with the range bound market. It requires patience to wait for a correction/pullback and then skill to identify its end.
“Remember a trend starts after end of a correction”
It can be difficult also because of the fact that a pullback can be deep or shallow.
Let me explain it further to simplify the things:
If the pullback is deep and you entered into the trade early then you have to suffer a lot of pain. It may force you to prematurely exit your trade in loss. On the other hand, if the pullback is shallow and you enter your trades too late, you risk missing the move.
So, we must have a solution on which we can rely to timely enter into the trade.
Here I am introducing a Trend Line Breakout technique that helps you make perfect entries into the trade.
Here’s how this fits into your trend line trading strategy…
- Identify an uptrend with higher high formation
- Wait for a pullback in an uptrend
- Draw a Trend Line connecting the highs of the pullback
- If the price breaks the Trend Line, then enter the trade
Here’s an example:

Before working on to any strategy you must understand the logic behind it, Here’s the logic of the above strategy…
If the price breaks above the Trend Line, it tells you the buyers are in control and the trend is likely to resume.
If it doesn’t, then it means the sellers are still in control and you want to stay on the sidelines till the buyers regained control.
To learn more about breakout trading read our breakout trading guide
Pro Tip:
Trend Line Trading: How to better time your entries
To get better entry opportunity and good risk reward trades your entry must be near the trend line. This gives freedom to keep a tight stop loss and improves risk reward.
But that’s not all…
“So when do I enter a trade?”
Reversal candlestick patterns, such as the Hammer and Bullish Engulfing, can be used as your entry trigger.
As a result, you only ever place a trade when the market has “bounced off” the Trend Line and is most likely to continue moving upward.
Conclusion
- Focus on the major swing points when drawing a Trend Line.
- Connect the major swing points to create the Trend Line.
- Adjust the Trend Line to maximize the number of touches.
- The steepness of a Trend Line provides insights into the market condition for adjusting trading strategies.
- Utilize the Trend Line Breakout technique to time entry in a trending market.
- Use a Trend Line to trail stop loss and ride significant trends.
- When a Trend Line breaks, wait for a re-test and observe if it holds.
- If the Trend Line holds during the re-test, the market is likely to reverse in the opposite direction.
Share your experiences and thoughts on how you use Trend Lines in trading by leaving a comment below.