
ICICI Bank Daily Chart
- ICICI Bank is trading at a 13% discount from its all-time high level.
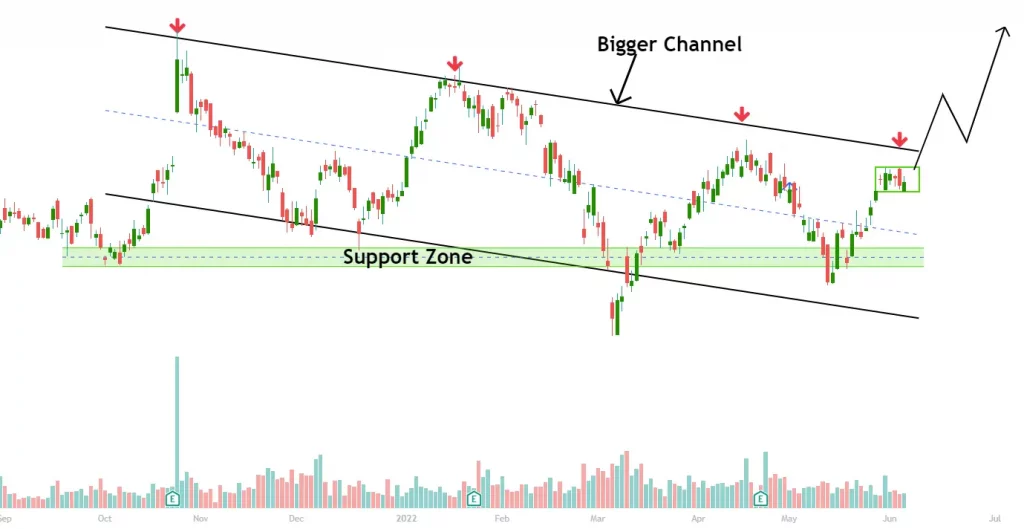
- The stock price is stuck between a channel. The bigger channel in the daily chart is a correction of the previous upmove.
- The current crucial levels of this channel are from 675-700 on the lower side and 750-775 on the upper side
- A breakout from this channel will start a new trend, most probably on the upper side of the channel
Why High Probability Setup?
- ICICI Bank is a consistent performer in the Indian stock market and generating wealth for their investors. It hit its fresh all-time high on 21st October 2021 and in the last 9 months stock has given negative returns. Now, it should move in either direction out of this channel
- This is the 4th time when stock is hitting the same channel and that to in one year span ( High probability of breakout after the 3rd attempt)
- Near the previous swing high stock is showing buildup, which further increases the probability of the breakout
- It will show multiple entry opportunities like breakout, pullback, or continuation patterns in the coming days
Conclusion
ICICI Bank is one of the best and most reliable stocks in the Indian stock market. The stock is expected to breakout the channel above 760 level. This breakout may push the stock up to its all time high level i.e., 850+. Short to medium-term traders should try to identify buying opportunities after the breakout.
Subscribe to our trading page on Instagram and Telegram for daily insights about trading moves.